Why and how to build a chart Ishikawa
Forming Educational Program / / December 19, 2019
What is Ishikawa diagram
The idea of the diagram cause-effect relationships in the form of a fish bone belongs to the largest expert in quality management Kaoru Ishikawa. This technique was originally used for the analysis of the factors that lead to manufacturing defects. But over time it began to be used in other processes where something broke or goes according to plan.
method "fish bone"Remains popular more than half a century. This is not surprising, given that he:
- It makes it possible to delve deeper into the problem, examine it from different angles and sometimes unexpected identify causal relationships;
- It helps to reveal the creativity and unconventional approach to the issue;
- versatile - the diagram can be used in different life and work situations, when the results do not live up to expectations.
How to build a chart Ishikawa
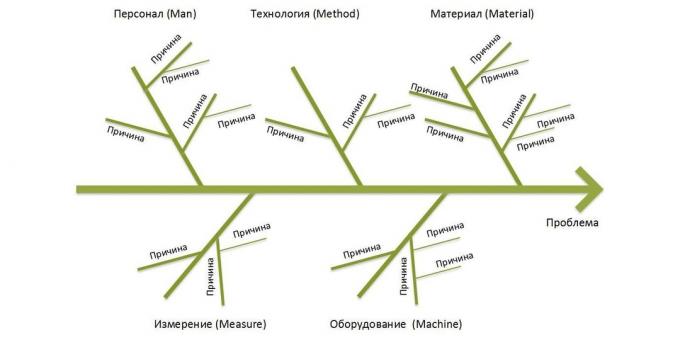
The graph can be drawn on a large sheet of paper or on the board. The "fish head" - right - formulate your problem. From the "ridge" moving away large side "bones" - the main reasons (first-order factors) that could lead to this situation. They are strung small "bones" to explain what caused the complication. And so, until you identify all the details that affect your fundamental question.
Here is a classic Ishikawa diagram in the bookCost ≠ value. Modern techniques of mapping the value stream by using the 80/20 rule Philip Semonycheva "Value ≠ value. Modern methods of mapping streams with value 80/20 rule»:
Now see, what to do in practice.
1. Assemble a team to brainstorm
In constructing diagrams used method brainstorm. To do this, invite specialists from different departments.
Let us examine an example a hypothetical pain-store bakery owner - a drop in demand on the buns with poppy seeds. Each expert, guided by their experiences, throws ideas why this could happen. Another answer is to give rise to the next question. It can turn around such a dialogue:
- Why dropped the demand for scones?
- Because they have become tasteless.
- Why did they become tasteless?
- Because the poor used poppies.
- Why do we use a bad poppy?
- Because it decided to save money and bought a poppy cheaper.
2. Capture all the ideas on the "fishbone"
At this stage, we are taking all ideas, Even the most insignificant or even delusional. It is only important to correctly position them on the diagram. Global portrayed as a major "bones" of the first row. And they are joined by the factors of the second, third and so on levels following causal logic.
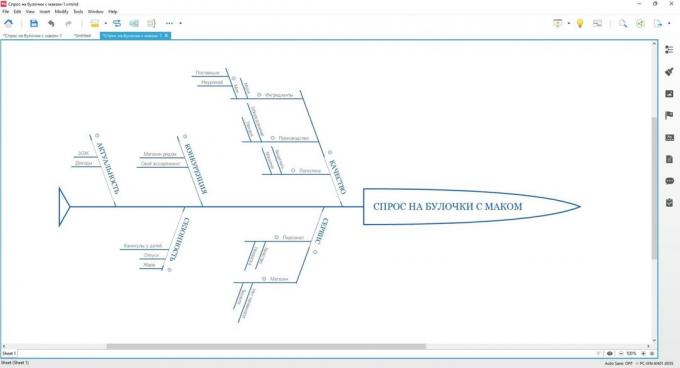
In the case of the first order on the rolls falling demand problem may be as follows:
- poor quality;
- service defects;
- high level of competition;
- seasonality;
- irrelevance of the goods.
After this string on each major issue causes the second and third order.
Why in the bakery of poor quality?
- Due to problems at work (obsolete equipment, low-skilled bakers).
- Because of poor quality ingredients (flour overdue, stale poppy).
- Due to the overlap with the logistics (rolls get into the point of sale chorstvymi).
Why in the bakery bad service?
- The reason for personnel (rudeness, lack of employees).
- The reason the shop (no terminal for payment cards, uncomfortable room).
Why increased competition?
- Near opened a similar store.
- The range appeared more delicious buns.
Why people do not buy the buns in the summer?
- Buyers went on vacation.
- In hot weather do not want biscuits.
- In the school holidays, parents do not buy children snack on scones.
Why is the buns lost their relevance?
- In the fashion of a healthy lifestyle (more and more people refuse to flour or limit themselves to it).
- Revenue fell (not enough even for bread, which rolls).
- Revenues increased (buyers got rich and moved to eclairs).
3. Evaluate the effect of each factor
When the chart is completed and all of the ideas have been exhausted, with the team analyze the impact of each of the major "bones" on the final result. You can roughly estimate the contribution percentage or to determine the degree of importance (large, medium, small).
4. Work with those on that can affect
Cut the factors that you can not influence. For example, do the best you can cancel the craze on diets. And focus on the most important things that really make a difference. Perhaps it is time to find another supplier poppy. Or switch to the production of éclairs.
How to build a chart in Ishikawa XMind
The disadvantages include Ishikawa diagrams of its bulkiness. Sometimes the "seed" so much that they just do not fit on the board. But the problem is easily solved if the scheme set up on the computer.
The easiest way to do this in XMind - a popular and easy program for drawing mental maps (mind mapping). Its advantage is that it is suitable for all platforms: Windows, macOS, Linux, Android, iOS. The free version contains a variety of templates, some of whom are Ishikawa diagram. And here it is possible to build from left to right and vice versa. A more comprehensive package is worth $ 40 for half a year or 60 - for the year.
When creating a new document, you automatically get to the templates gallery. All you need to do - is klatsnut for "fishbone" and then select the desired style from several options. The design can be changed at any stage of a mouse click, so do not torture too long.
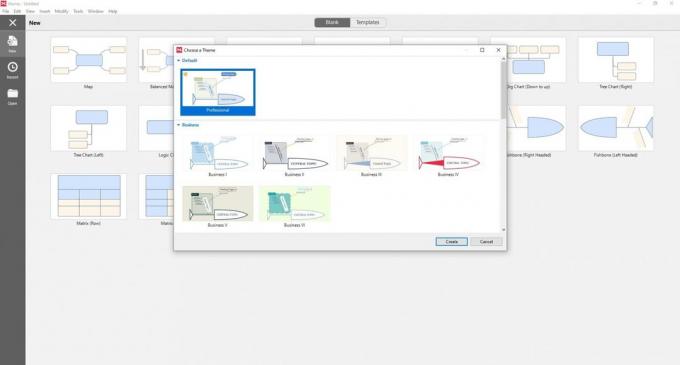
The first step is to display the "head", and where necessary to formulate the problem.
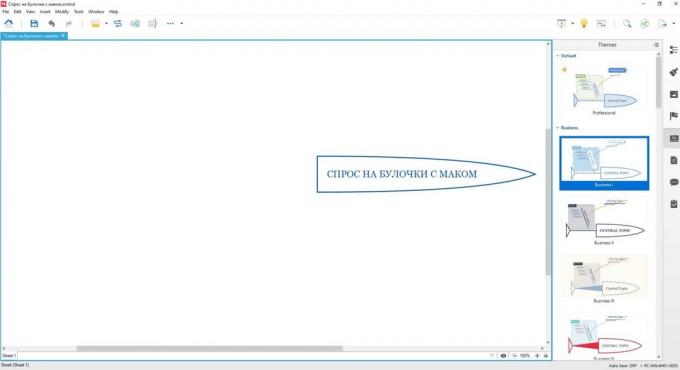
Now click once on the "head" of the left mouse button and press Enter or Tab. The "fish" otrastot "backbone" and will be a "bone" of the first order.
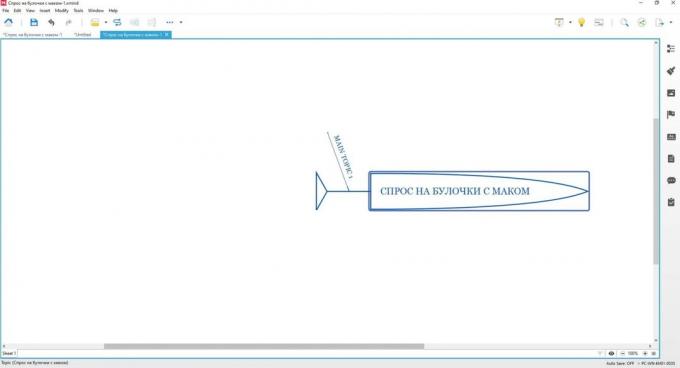
While continuing to hold the mouse on the "head" and pressing Enter, you will get much larger branches as you need. Alternatively, you can move the mouse over the large "bone" and also press Enter. As a result, a number will increase one more the same. Then just have to rename them. To do this, double-click the left mouse button on the desired branch and enter the name Problems.
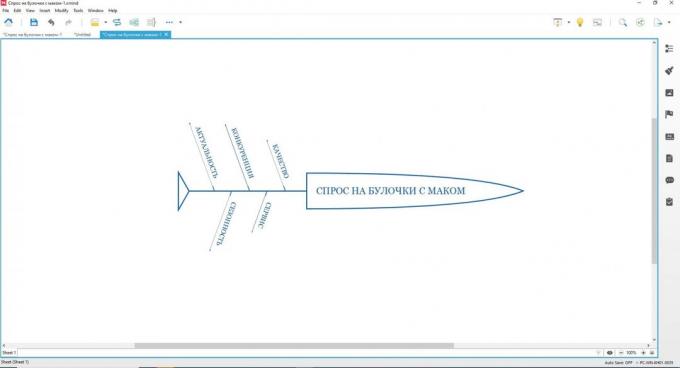
To get smaller "pits", hover your mouse over a large branch and press Tab. In general rule the following: branch of the same order are joined with the Enter button, and the smaller subsidiaries or - button Tab.
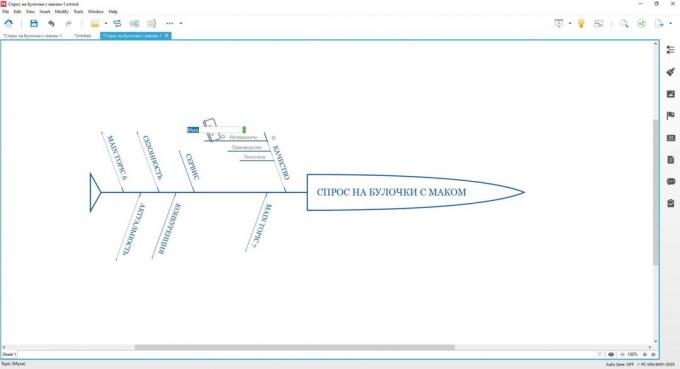
Fill in all the branches. In our case, with scones end result will look like this:
Download XMind →
see also🧐
- How to sort out any problem: the technique of "5 Whys"
- What is the map of ideas and how to work with it
- Gantt chart - a tool for anyone who does not like to disrupt the timing
- 3 brainstorming secret by Google
- How to set goals with the help of mental maps


